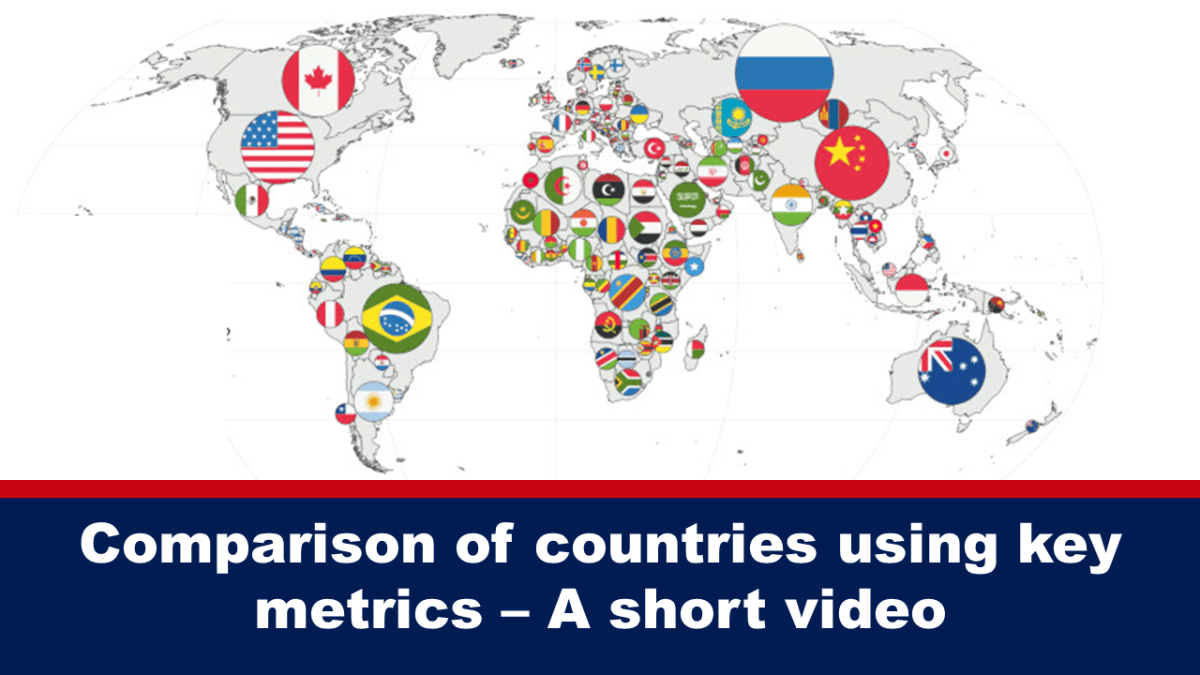
Comparison of countries using key metrics – A short video
Visual Capitalist has created a video showing the countries of the world by 20 key metrics. It collates data from the World Bank and graphically compares metrics such as populations, gross domestic products, military expenditure, and fuel and technology exports. The data was sourced in July 2022 and contains the latest available data for each country.
In an article, Visual Capitalist highlights 8 of the 20 metrics with brief remarks. You can read their article HERE.
There are other metrics shown in the video that Visual Capitalist didn’t highlight but are also interesting. Such as outgoing and incoming refugees. The latest data for refugee migration on the World Bank website is for 2021 for most countries. You can find the World Bank data for “outgoing refugees” HERE and “incoming refugees” HERE.
Let’s not lose touch…Your Government and Big Tech are actively trying to censor the information reported by The Exposé to serve their own needs. Subscribe now to make sure you receive the latest uncensored news in your inbox…
Other interesting comparisons are military and research expenditure which, by simply comparing the size of the circles, seem almost as if they could be superimposed onto each other.
The image above shows a US military expenditure of $781 billion. Although we don’t know how Visual Capitalist collated the data we could assume any military research is not included and is in addition to the $720.9 billion research expenditure shown separately.
On the World Bank website, the latest data recorded for military expenditure relate to 2020. Although Visual Capitalist’s expenditure for the US military differs by roughly $3 billion from the World Bank’s data ($778.2 billion), we assume the figures collated into the Visual Capitalist’s video relate to 2020.
Earlier this year The Balance published an article detailing the US military budget. The estimated military expenditure for the fiscal year 2022 was expected to be $754 billion which included a budget for the Department of Defence (“DoD”) of $715 billion. Of the DoD’s budget, $14.7 billion was allotted to Science and Technology, and $112 billion was allotted to Research, Development, Test and Evaluation (“RDT&E”).
The Defense Advanced Research Projects Agency (DARPA”) seems to be included in the RDT&E expenditure based on the description in DARPA’s more detailed budget, see the headings of the images below.
In 2022, out of the $112 billion allocated to RDT&E, the budget for DARPA was $3.9 billion with $1.4 billion, later increased to $1.5 billion, being allocated to biomedical technology, biological warfare and information, and communications technology. Similar amounts were allocated to DARPA and these projects in 2020.
In 2023, the President’s budget request for DARPA is $4.119 billion with $1.6 billion being allocated to biomedical technology, biological warfare and information, and communications technology.
Although none of this information gives any qualitative information and some of the dollar value increase may be due to inflation, it is food for thought that the budget for RDT&E is increasing considering the concerns raised about DARPA’s involvement in biolaboratories in Ukraine, the origins of SARS-CoV-2 and that, in the US at least, the Covid injection campaign is a military program.
Further resources:
- Ukraine biolabs on The Exposé
- From Covid-19 to BioLabs; all roads lead back to the U.S. Defense Threat Reduction Agency
- Evidence of Covid Pandemic and Bioweapon Cover-Ups all leads back to Metabiota, Peter Daszak and Hunter Biden
- DTRA on The Exposé
- How DARPA and Moderna pioneered the idea behind mRNA vaccines
- Dr. Peter McCullough: Covid “vaccines” are a US military program


