
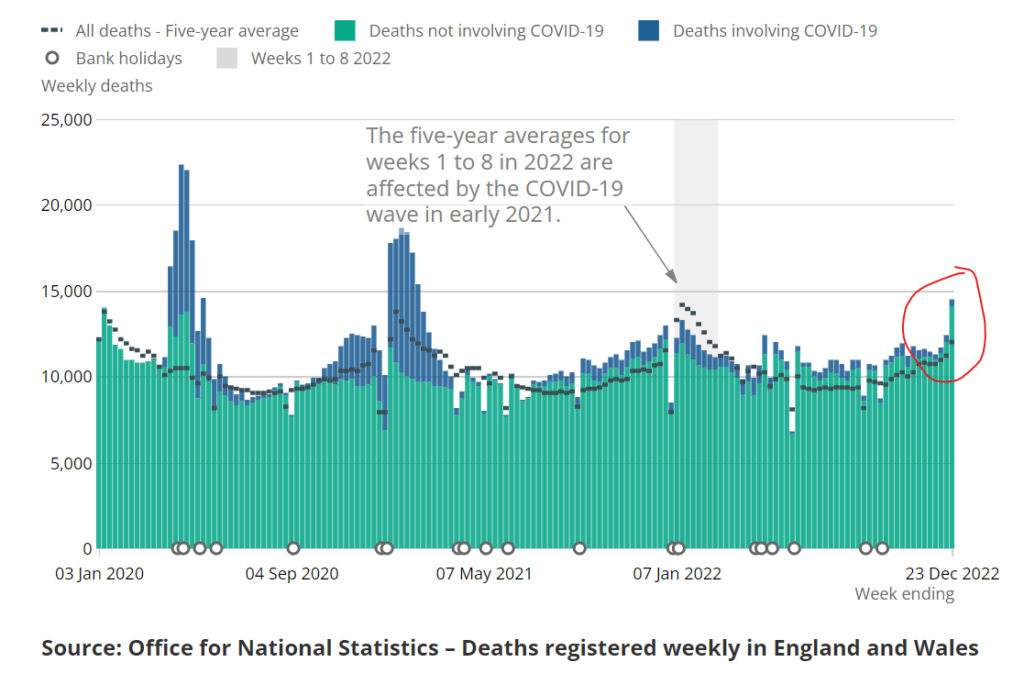
Excess Non-Covid Deaths Surge to 30,000 Since April as Deaths in Week Before Christmas Hit 20% Above Average


Deaths registered in England and Wales were a massive 20.7% above the five-year average in the week ending December 23rd, according to the latest data from the ONS. There were a total of 14,530 deaths that week, which is 2,493 above the five-year average. Of these, 429 involved COVID-19 as a contributory cause and 308 were due to Covid as underlying cause, leaving 2,185 excess non-Covid deaths. Of the total, 829 deaths were recorded as due to ‘influenza and pneumonia’ as underlying cause. The total number of excess non-Covid deaths since the surge began in April is now just shy of 30,000 at 29,880.

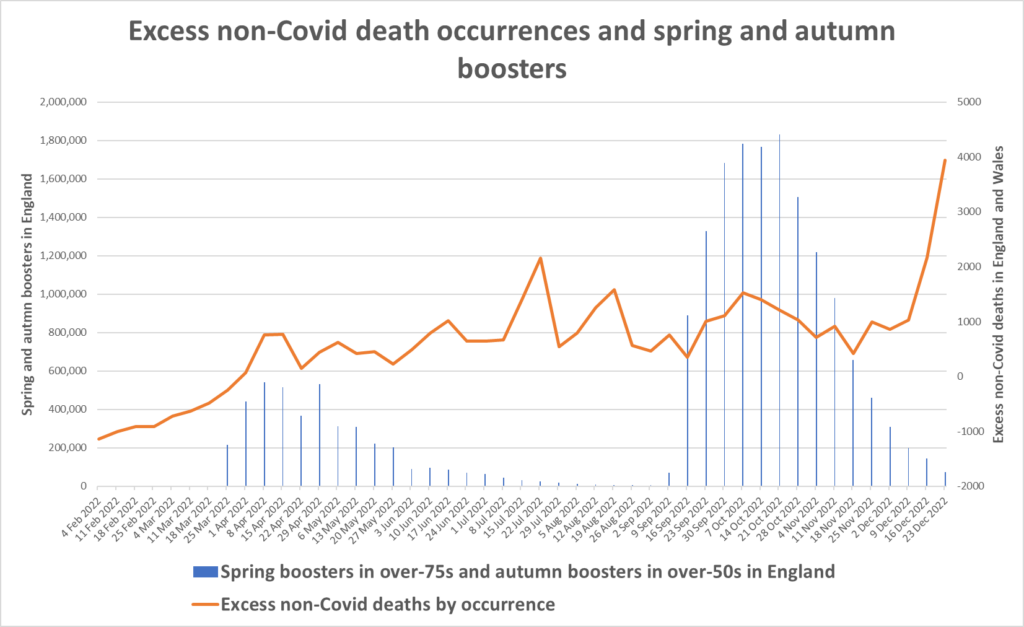
The chart below plots the deaths by date of occurrence. I have also plotted the vaccine boosters, though clearly the latest surge in excess deaths (unlike those in the spring and autumn) has no correlation with new booster doses.

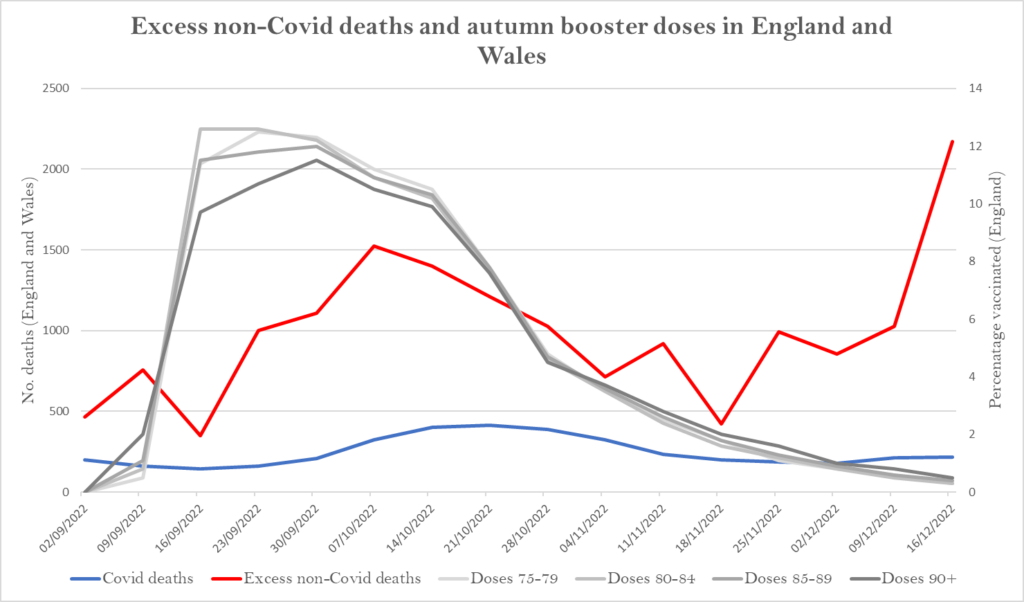
This chart shows autumn booster doses in over-75s along with excess non-Covid deaths, showing the correlation during the autumn, though not in December. Covid deaths are also shown.

The cause of the huge number of excess deaths in December is unclear. Detailed cause of death data are not yet available for December. The excess deaths are concentrated in the older age groups, with no notable rise in the under-50s, who were notably excluded from the autumn booster campaign. It is a severe flu season, so this will be contributing. The pressures on hospitals, ambulances and other health services will also be playing a part. Once again, the rise in excess non-Covid deaths has occurred at the same time as a wave of Covid infections. This phenomenon has been observed internationally and the reasons for it are unclear. An interaction between the Covid vaccines and Covid infection, perhaps resulting in deadly autoimmune attack on vital organs such as the heart, or via some other mechanism, remains possible and requires further investigation.
Are excess deaths higher in the vaccinated? The U.K. Government, like other governments, does not publish good quality data on deaths by vaccination status (which seems suspicious in itself). However, deaths during 2022 are notable for reversing the usual demographic trends, with less deprived groups and white people having higher excess death rates, as shown in the charts below, which were produced by HART. Note how the red line moves from being at the bottom in 2021 to at or near the top in 2022.
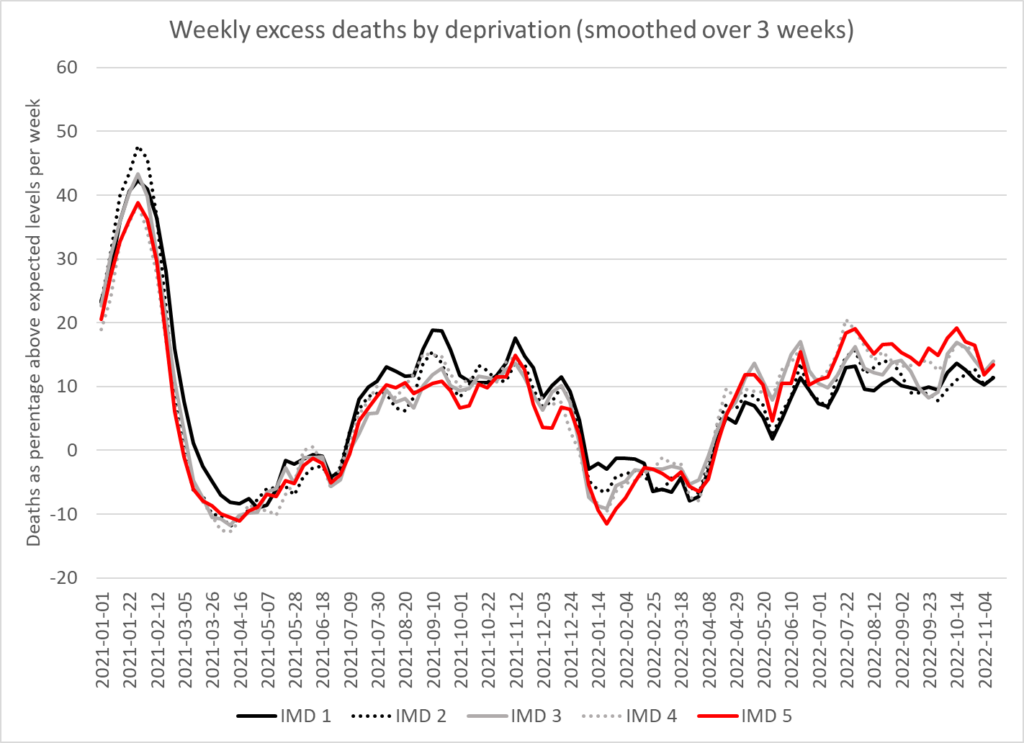

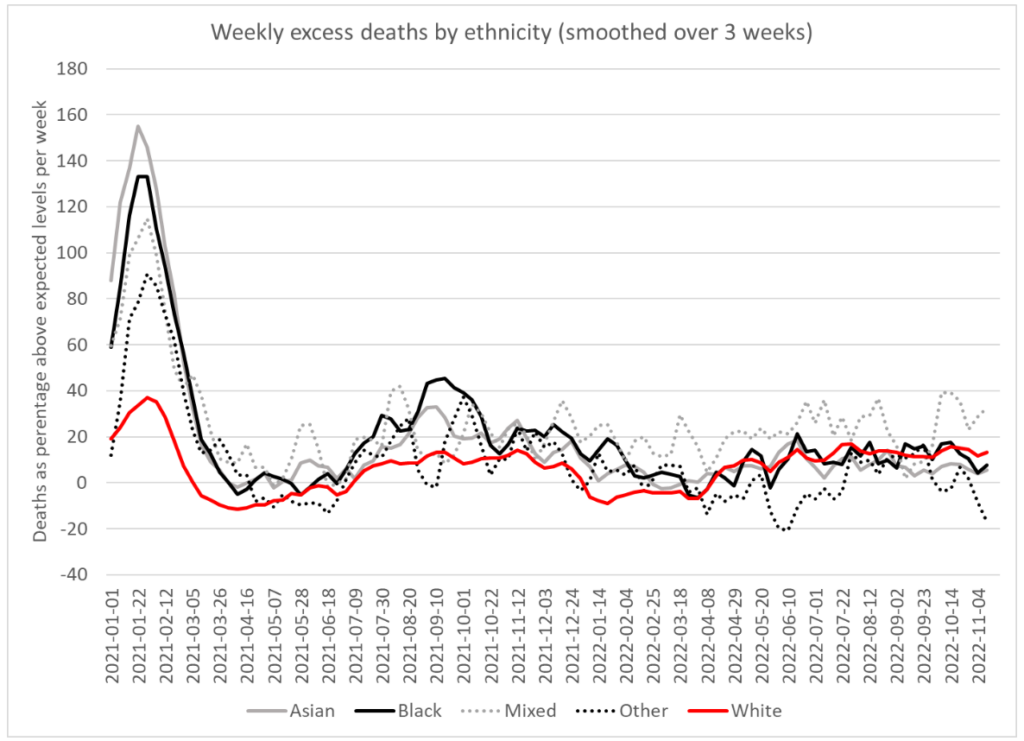

The most notable difference between these demographic groups that could explain such a remarkable shift is that whites and less deprived groups tend to have higher vaccination rates. For example, despite being more diverse and lower income, London had much lower excess deaths than the South East during 2022. Between May 1st and November 18th, London had excess mortality of 8% versus 13% in the South East. London is double-jabbed 80% and triple-jabbed 64%, well below the rates in the South East, which is double-jabbed 90% and triple-jabbed 80%. This is hardly conclusive proof, but alongside other data is highly suggestive that vaccines are playing a role in the recent high excess mortality.


